

In August 2026, global financial markets reached a critical turning point. After experiencing volatility and adjustments in the first half of the year, the US stock market presented a new pattern in mid-August. As a benchmark for global capital markets, the three major US stock indices—the Dow Jones Industrial Average, NASDAQ Composite, and S&P 500—showed clear divergent trends, offering investors abundant allocation opportunities. This article will conduct an in-depth analysis of the current operational characteristics, driving factors of US stock indices, and implications for Southeast Asian investors.
Latest US Stock Market Trends: Divergent Pattern Emerges
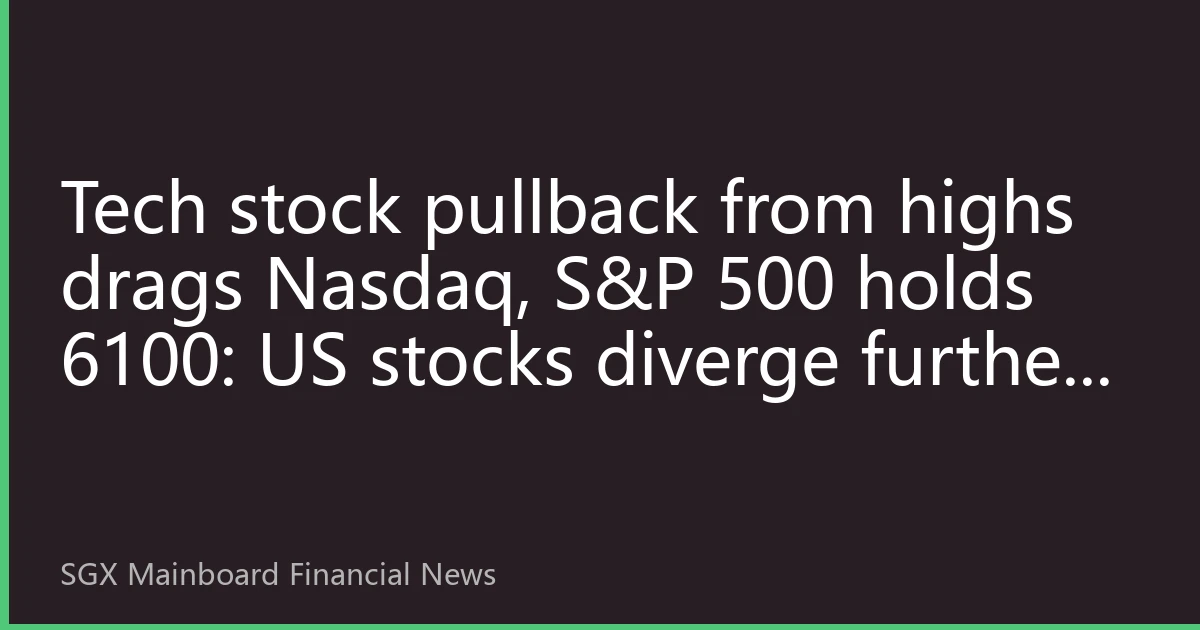
As of the close on August 17, 2026, the three major US stock indices showed distinctly different performances. The Dow Jones Industrial Average climbed steadily, closing at record highs for three consecutive trading days, mainly supported by traditional industrial and financial sectors. Meanwhile, the NASDAQ Composite experienced volatile adjustments, with tech giants facing valuation pressure, but AI-related stocks remained strong. The S&P 500 index, positioned between the two, demonstrated strong resilience, with over 60% of its components posting gains.
This divergent pattern reflects current structural changes in the US economy and differentiated market expectations for various industries. The strong performance of the Dow indicates continued vitality in traditional economic sectors, while the NASDAQ adjustment suggests the tech sector is entering a valuation digestion phase. The S&P 500, as the broadest market indicator, shows stable trends, reflecting healthy overall market fundamentals.
Driving Factors Behind Dow's New Highs
The strong performance of the Dow Jones Industrial Average was mainly driven by the following factors:
- Traditional industrial sectors exceeded expectations, particularly manufacturing and energy companies whose second-quarter earnings generally surpassed market expectations
- The Federal Reserve's stable interest rate policy stance helped control financing costs for traditional enterprises
- Against the backdrop of global supply chain restructuring, US manufacturing received policy support, with related companies experiencing significant order increases
- Inflation data showed signs of cooling, alleviating market concerns about further Fed tightening
Notably, heavyweight stocks in the Dow such as Boeing, Caterpillar, and UnitedHealth contributed most of the gains. The strong performance of these traditional industries formed a stark contrast with the tech sector, reflecting market style rotation.
Logic Behind NASDAQ Adjustment
Different from the Dow's strength, the NASDAQ Composite adjusted in mid-August, mainly affected by the following factors:
- Large-cap tech stocks were at historically high valuations, with some investors choosing to take profits
- AI-related concept stocks shifted from frenzy to rationality, with the market beginning to focus on their commercial implementation capabilities and business models
- Changes in the interest rate environment created pressure on high-growth, high-valuation stocks
- Geopolitical risks intensified, particularly concerns about the impact on the tech industry chain
Despite the overall adjustment, the NASDAQ market still had bright spots. Although AI leaders like NVIDIA and Microsoft experienced stock pullbacks, institutional investors remain bullish on their long-term growth potential. Meanwhile, the semiconductor sector showed relative resilience amid expectations of a chip cycle recovery, showing internal differentiation within the tech industry.
S&P 500: Balanced Market Performance
As the most representative US stock index, the S&P 500 showed strong balance in August. While major sectors like technology, healthcare, finance, and industry in the index's components performed differently, overall volatility remained at low levels, reflecting the relatively cautious attitude of institutional investors.
In terms of sector performance, the information technology sector in the S&P 500, though with lower gains than in the first half, maintained its leading position; the healthcare sector benefited from population aging and medical innovation, showing steady performance; the financial sector gradually recovered against the backdrop of mild economic recovery; while the energy sector performed prominently with high oil prices and policy support.
Key Technical Indicator Analysis
From a technical perspective, the three indices showed different trend characteristics:
- The Dow Jones Industrial Average broke through previous resistance levels, with MACD indicators confirming an upward trend and trading volume continuously expanding
- The NASDAQ Composite found support near key support levels, with RSI indicators showing oversold rebound signs but still in a downward channel
- The S&P 500 hovered around important moving averages with relatively stable trading volume, showing balanced forces between bulls and bears
These technical indicators suggest that the current US stock market is experiencing structural trends, with obvious rotation characteristics between different indices and sectors. Investors need to make differentiated allocations based on their risk preferences and investment objectives.
Macroeconomic Background and Policy Impacts
The trend of US stock indices is inseparable from the influence of macroeconomic environment and policies. In August 2026, the US economy showed signs of mild recovery, with main economic indicators showing gradual easing of inflationary pressures, a resilient job market, and rising consumer confidence. This macroeconomic background provided fundamental support for the stock market.
In terms of monetary policy, the Federal Reserve maintained interest rates unchanged at its August meeting but signaled possible policy adjustments in the coming months. This stance avoided the impact of excessive tightening on the economy while maintaining flexibility to address inflation, providing relatively stable policy expectations for the market.
In fiscal policy, the US government's infrastructure investment plan was gradually implemented, benefiting traditional industries; at the same time, continuous support policies for technological innovation were launched, providing long-term growth momentum for the tech sector. This policy combination had differentiated impacts on different sectors, also an important reason for market divergence.
International Factors' Impact on US Stocks
As the world's largest capital market, US stock market trends are significantly affected by international factors. In August 2026, policy divergences among major global economies, geopolitical tensions, and changes in international trade relations all had varying degrees of impact on the US stock market.
The Southeast Asian region's continuous economic growth has become a hotspot for global capital attention, a factor that indirectly affected capital allocation strategies in the US market. Meanwhile, regional factors such as RMB exchange rate fluctuations and Southeast Asian stock market performance were transmitted to the US market through cross-border capital flows, increasing market complexity and uncertainty.
Implications and Strategic Recommendations for Southeast Asian Investors
For Southeast Asian investors, the current divergent pattern in the US stock market presents both challenges and opportunities. As an important part of global allocation, US stock market investment needs to incorporate regional characteristics and investor needs to formulate differentiated strategies.
Asset Allocation Strategies
Based on the current trend characteristics of US stock indices, Southeast Asian investors can consider the following allocation strategies:
- Core-satellite strategy: Use S&P 500 index ETFs as core allocation to obtain market average returns; while allocating Dow components and NASDAQ tech stocks as satellites to capture structural opportunities
- Sector rotation strategy: Pay attention to the rotation rhythm between traditional and tech industries, increasing allocation in relatively low-valuation sectors
- Geographical diversification strategy: On the basis of US stock allocation, appropriately increase Southeast Asian local market allocation to achieve geographical risk diversification
Risk Management Measures
In the process of US stock market investment, risk management is crucial. Southeast Asian investors should take the following measures:
- Control the proportion of single-market allocation to avoid excessive concentration in US stocks
- Use derivatives like options to hedge systematic risks
- Set stop-loss points to control volatility risks of individual stocks and sectors
- Regularly review investment portfolios and adjust allocations promptly according to market changes
Long-term Investment Perspective
Although short-term market volatility is inevitable, Southeast Asian investors should maintain a long-term investment perspective. The US stock market, as the most dynamic and innovative capital market globally, will continue to attract global capital inflows in the long term. For Southeast Asian investors, participating in the US market through tools like US stock ETFs and index funds is an important way to achieve global asset allocation.
Future Outlook and Investment Opportunities
Looking at the second half of 2026, the US stock market may show the following trend characteristics:
- Under the expectation of an economic soft landing, the US stock market as a whole still has structural opportunities, but volatility may rise
- After valuation adjustments, the tech sector may welcome a second wave of growth driven by earnings
- Traditional industries may achieve relative returns against the backdrop of mild economic recovery
- The Federal Reserve's policy shift will become an important market catalyst, possibly triggering reallocation of capital
For Southeast Asian investors, focus on the following investment opportunities:
- Companies related to the AI industry chain, including hardware, software, and application layers
- Clean energy and new energy technology companies benefiting from energy transition
- Traditional industry leaders with reasonable valuations and sustainable dividend capabilities
- Anti-cyclical assets that can hedge inflation risks
Conclusion
In August 2026, the US stock market showed a clear divergent pattern, with the three major indices showing different trends, reflecting economic structural changes and differentiated market expectations. The Dow's strong performance, NASDAQ's adjustment, and the S&P 500's balanced trend provide abundant choices for investors with different risk preferences.
For Southeast Asian investors, the current US stock market presents both challenges and opportunities. Through reasonable asset allocation, scientific risk management, and a long-term investment perspective, investors can obtain stable returns in the US stock market while achieving global asset allocation and risk diversification.
With the evolution of the global economic landscape and the continuous growth of the Southeast Asian region, the strategic value of the US stock market for Southeast Asian investors will further increase. Investors should closely monitor market changes, flexibly adjust strategies, effectively manage risks while seizing opportunities, and achieve long-term investment goals.